UV Testing FAQs – 15 most frequent questions and answers
This UV Testing FAQs section assembles the most frequently asked questions we receive from clients and companies regarding different UV testing procedures and tests.
Here are 15 most frequent UV Testing FAQs
1. What is the acceleration factor of a Xenon Arc or UV test?
For decades, weathering experts have tried to find that magic number, but there is no such magic number. No matter how the question is formulated, the answer is always the same: “It depends!” It depends for one simple reason: Mother Nature is not as reliable as lab equipment! While doing Weather-Ometer®* testing, we use calibrated lamps, specific filters, very accurately monitored irradiance, purified water, controlled atmosphere (humidity and temperature) and predefined light, darkness and rain cycles. On the other hand, Outdoor exposure depends on when and where you are: Latitude, altitude, cloudiness, humidity, smog, rain, temperature, orientation, season, time of day… all those parameters have a major influence on the “efficiency” of outdoor exposure hence the acceleration factor.
Several published studies and standards lead to an average acceleration factor of 9 between accelerated lab exposure under harsh conditions such as Florida or Arizona.
For example, to assess the performance of anti-graffiti coatings, ASTM D6578 calls for 24 months outdoor exposure (Florida or Arizona exposure) or 2000 hrs of accelerated aging. In that case, they assume an acceleration factor of 8.8 (2 years (17520 hrs) / 2000 hrs)
In more moderate climates (like Boston, Montreal or Chicago), the acceleration factor increases. Our own studies show acceleration factors of 20 and more for this climate type on standardized polystyrene coupons.
Those average acceleration factors are just orders of magnitude because they can drastically vary from one product to another, or one location to another. Feel free to contact our experts to discuss what would be the most realistic scenario for your product.
2. I want to perform an accelerated light aging test, what type of machine should I use?
There are 3 main kinds of machines available: Carbon Arc, Xenon Arc and Fluorescent UV testers. Carbon Arc is the oldest technology (developed in the 1930’s) for accelerated aging and is now regarded as inaccurate and outdated. For more info, please refer to “What is the difference between Xenon Arc and Carbon Arc”. The 2 types of machines used nowadays are Xenon Arc and Fluorescent testers. One is not better that the other, they just have different purposes. Xenon Arc testers simulate the full sun spectrum and Fluorescent testers focus solely on the UV radiations emitted by the sun. If your main concern is your product changing color (fading), Xenon Arc is the best option for you. If you are working with polymers and your main concern is the degradation of their properties (loss of mechanical strength, yellowing, cracking), Fluorescent tester is your best option. For more information: “What is the difference between Xenon Arc and Fluorescent (UV) testing?”
3. What is the difference between Xenon Arc and Fluorescent (UV) testing?
Xenon Arc tester is the best sun simulator available today. By using the right combination of filters we can simulate sunlight very precisely (wavelength range and relative amplitude of each wavelength) for either outdoor or indoor conditions. Irradiance (quantity of light emitted), humidity, rain and dark period are set to optimize and accelerate the fading of your product under very realistic conditions.
Xenon Arc is the best choice for:
- Color loss evaluation (fading of dyes and pigments)
- Materials that react to humidity change (Textile)
- Indoor exposure simulation (Furniture or household products)
- Outdoor exposure simulation
Fluorescent tester is the best UV simulator available today. Polymers and their additives (like antioxidants) react mostly to UV radiations emitted by the sun in the 300-400 nm[5]. Those photochemical reactions, combined with the effect of condensation, induce polymer degradation (gloss loss, changes in mechanical properties, yellowing or cracking).
As the most damaging UV radiations (below 310 nm) are filtered by window glass, fluorescent testers are best suited to simulate outdoor exposure of polymers when the main concern is structural changes in the polymer itself. For indoor exposure and fading evaluation, Xenon Arc should be the preferred option.
4. What is the correlation between Xenon Arc and Fluorescent (UV) testing?
There is no correlation between the 2 types of exposures because they have different emission spectrums and ambient parameters (i.e.: one has condensation cycles, simulating dew, the other one has rain cycles). You still may find old standards on the internet referring to a total energy emitted during the test (in MegaJoules for example) as test criteria. Test methods have been substantially refined since then and we recommend not using the test criteria.
The misconception of using the total energy received can be compared to lifting weights. If I lift 10 Lbs 50 times, I lifted a total of 500 Lbs. Does this mean that I can lift 500 Lbs at a time? Obviously not, it all depends on how you break down the 500 Lbs. The same logic applies for emitted light: the outcome of receiving 20 times 1 joule of light at 325 nm and receiving 20 joules of light at 655 nm are two completely different things. The total average is the same however that information is irrelevant and useless to draw a conclusion. What you need to know is the amount of energy at different wavelengths.
In more technical words, 1 Joule of UV light at 325 nm will cause severe damages to a polymer whereas 1 joule of visible light at 655 nm will not, as there is no “receiver” in the polymer itself that can use visible light and induce temporary or permanent structural modifications by electron jumps between energy levels[6].
5. What is the difference between Xenon Arc and Carbon Arc testing?
Carbon Arc testers were introduced in the 1930’s, they were the best available sun simulators at the time. Carbon Arc testers were pioneers in the technology of accelerated aging. That technology is still called up in some standards even though there is nowadays a much better technology: Xenon Arc. Xenon Arc can be seen as “Sun simulator 2.0” compared to Carbon Arc. In lab testing Carbon Arc was superseded by Xenon Arc in the 90’s. The most recent and up-to-date standards only refer to Xenon Arc. Please refer to “What is the correlation between Xenon Arc and Carbon Arc testing? “ for additional information.
6. What is the correlation between Xenon Arc and Carbon Arc testing?
There is no correlation between the 2 types of exposures because they have different emission spectrums. Furthermore, Carbon Arc emission spectrum is a poor simulation of the sun spectrum because of 2 major mismatches:
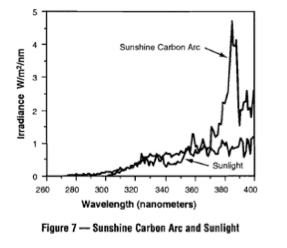
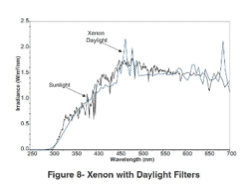
Considering that shorter wavelengths carry the most energy, the 2 issues described above make Carbon Arc a poor choice considering that Xenon Arc is a much better simulation of the sun spectrum. Back in the 1930’s, Carbon Arc was the best available sun simulator, however it was quickly replaced by Xenon Arc in the 70’s.
7. What do L*.a*.b*. values and DE represent?
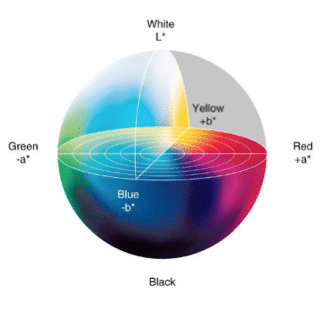
L*.a*.b*. coordinates refer to the coordinates of the color in the CIELAB 76 sphere. It is actually a three-dimensional space where the L* axis represents the “lightness” of the color (Black to white), a* is the green-red axis and b* is the blue-yellow axis. L* axis goes from 0 (darkest black) to 100 (brightest white), a* goes from -100 (green) to + 100 (red), b* goes from -100 (blue) to + 100 (yellow)[1].
DE = [ (L2*- L1*)2 + (a2*- a1*)2 + (b2*- b1*)2 ] 0.5
It was found that the Just Noticeable Difference (JND)[2] is, for most people, at DE =2.3. That means that the magnitude of difference between 2 colors must be 2.3 or more to be noticed. Over the years, some industries came up with their own JND value based on specific needs and applications. The 2.3 value is, however, still widely used as the JND.
Other rating scales can be found in the literature:
Scale #1 [3]:
0,0 < DE ≤ 0,5: No color difference
0,5 < DE ≤ 1,0: Difference only perceivable by experienced observers
1,0 < DE ≤ 2,0: Minimal color difference
2,0 < DE ≤ 4,0: Perceivable color difference
4,0 < DE ≤ 5,0: Significant color difference
5 < DE: Different colors
Scale #2[4]:
0 < DE ≤ 1: Observer does not notice the difference
1 < DE ≤ 2: Only experienced observer can notice the difference
2 < DE ≤ 3.5: Unexperienced observer can notice the difference
3.5 < DE ≤ 5: Clear difference in color is noticed
5 < DE: Observer notices two different colors
8. What is the difference between SCI and SCE color measurements?
SCI (Specular Component Included) measures the true color of an item, ALL the reflected light is captured, regardless of the reflection angle (specular, scattered or diffuse)
SCE (Specular Component Excluded) measures the perceived color of an item, the specular component of the reflection (which is usually the dominant type of reflection) is excluded to make the result more sensitive to scattered light caused by the surface conditions (gloss and texture).
For more specific info on this topic, please refer to our page “What is the difference between the “true” color of an item and its perceived color (by the human eye)?”
9. I want to simulate 2, 5 or 10 years of natural exposure, how long will it take [in accelerated lab conditions]?
Please refer to “What is the acceleration factor of a Xenon Arc or UV test?”
10. I’d like to have intermediate measurements taken, what intervals should I choose?
Aging is usually a non-linear process, therefore we suggest the following intervals in order to catch early failures or changes:
0, 100, 300, 500, 750, 1000, 1500, 2000 hrs (followed by 1000 hrs increments afterwards). Depending on how confident you are on the short term behavior of your product, some early intervals can be skipped.
11. What is the difference between the terms Sample and Specimen?
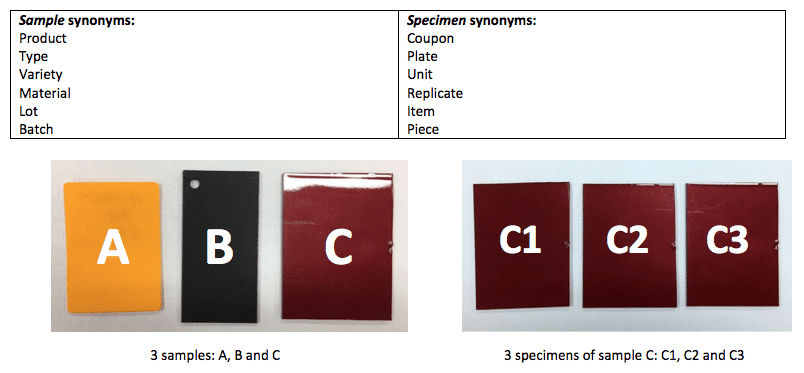
In the Testing Industry, a sample is a type of product and a specimen is an individual unit. In other words, specimens are identical “items” and samples are different “items”.
For example, if I have 4 identical apples in front of me, I have 4 specimens of the same sample. On the other hand, if I have 1 apple, 1 orange and 1 peach: I have 1 specimen of 3 (different) samples.
Samples and specimens are arguably the most accurate terms to use to avoid any confusion, but synonyms are also used:
12. What is the difference between Yellowing and Fading?
The term Fading refers to the loss of color (bleaching effect). Some compounds like dyes and pigments are prone to photo degradation causing fading. Those photoreactions can occur at various wavelengths, not only in the UV region, but also in the visible and near infrared regions.
Yellowing is also a photoreaction but the “target” is the polymer itself or its additive (antioxidant or flame retardant) and it occurs in the UV region of the electromagnetic spectrum. Please refer to our “Practical Guide to UV Testing” for more info. A visual everyday life example is shown here “Why your old Super Nintendo Looks Super Yellow”.
The best equipment available to detect yellowing is called QUV. It is extremely good at simulating solar UV light, but any reaction taking place at longer wavelengths (Visible and near IR) will be missed. On the other hand, Xenon Arc testers mimic the sun spectrum very well in the visible and near IR regions.
If you are not sure what is the best choice for your product, please refer to “What is the difference between Xenon Arc and Fluorescent (UV) testing”
13. What is the difference between Greyscale and L*a.b* measurements?
In order to take L*a*b* measurements, flat, smooth, uniform colored area the size of a dime coin is needed. For more info on L*a*b* measurements, please refer to “What do L*.a*.b*. values and DE represent?”. In some cases, the design of your product does not meet these criteria and color measurements cannot be taken. An alternative solution, developped by the AATCC (American Association of Textile Chemists and Colorists) is used, called AATCC Greyscale. AATCC Greyscale is a visual assessment of the fading or alteration of color.
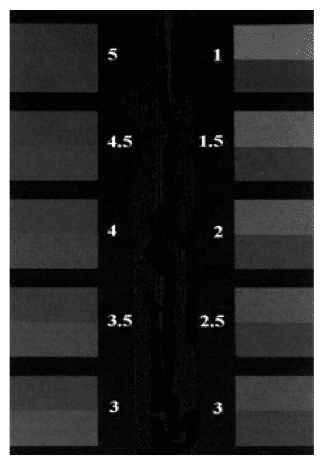
The picture on the right shows the 9 levels of Greyscale:
Top left corner shows the “no change level”: rating of 5 (upper grey and lower grey are identical).
Top right corner shows the “major change level”: rating of 1 (upper grey and lower grey are drastically different)
ASTM (ASTM D2616) proposes a correlation table between AATCC greyscale ratings and DE values (in SCI mode). However, we suggest to be very cautious if you decide to use this correlation table because variations along the Lightness L* axis or the chroma a* and b* axes that would give the same DE might be perceived significantly different by the human eye. Furthermore, as grey tones are technically variations along the L* axis, comparing Greyscale rating with a value (DE) that includes a* and b* can be misleading.
Visual evaluations like Greyscale requires a reference sample. Therefore, an unexposed specimen (kept in the dark between measurements) should be provided. When a reference sample is not available, a part of the exposed sample can be masked during exposure to act as a reference.
14. How many specimens of each sample should I test?
Non Destructive Testing:
If only non-destructive evaluations are performed (Color or gloss measurement for example), you can submit as little as 1 single specimen per sample. In that case the same specimen will go all the way to the end of the study.
If you want to remove specimens at specific intervals, the minimum number of specimens will depend on the total duration of your study and the number of intervals you have.
Destructive Testing:
If destructive testing is performed (tensile, flexion, impact, adhesion), a minimum of 5 specimens is usually needed per test. Considering that 48 to 60 specimens can fit in the machine, the intervals for destructive testing must be chosen wisely if multiple comparative products are tested simultaneously.
Keep in mind the number of specimens must be doubled for anisotropic materials when both directions have to be tested.
15. What are the standard dimensions of a test specimen?
The dimensions for a standard test specimen are as follows: 3’’ wide x 5’’long. Flat and no thicker than 1/8’’
Micom has the capability to accommodate 3-dimensional samples and large samples. If you cannot provide standard samples, our experts will work with you on the optimal approach.
We hope these UV Testing FAQs will help you better understand the overall UV testing. If you have any questions about UV tests, we invite you to contact us today. It will be our pleasure to answer your questions and help you with your UV testing custom requirements.
[1] a* and b* axis can technically go further than the usual ± 100 range but it never really happens in practice.
[2] Mahy et al. (1994)
[3] Published by Dr Bela Torok, M.D., Ph.D. (Ophthalmologist) on ResearchGate.net
[4] From « colour difference DE – A survey » by Mokrzycki W.S., Tatol M., University of Warmia and Mazury, August 2012.
[5] To avoid unrealistic damages to the product tested, standard lamps used in fluorescent testers do not emit light below 300nm as those wavelengths are naturally filtered by the atmosphere and never reach the surface of the Earth. For R&D and aerospace applications, shorter UV wavelength simulations are available. Please contact our specialists for more info.
[6] Some visible light will also be “absorbed” by the pigments, the non-absorbed light will “bounce back” and create the color we see.
*Weather-Ometer®️ is a registered trademark of Atlas Material Testing Technology LLC


